The study of air flow and smoke dispersion in different urban geometries could lead the urban planners to constitute simplified pre-planned actions in a case of a fire incidence. The fire position, the urban geometry, the wind direction and the fire intensity are the mainly parameters that could define the fire fighting measurements and the intervention plan. This chapter synthesizes the study of different urban scale fires and compose a map with the risk zones and flow behaviour around the urban accidents. Due to the fact that cities are having different geometries, the firefighting measurements depend on the local issues and demands. This study tries to give directions, for the composing of a general risk map plan that could be applied to most of the cities geometries.
Managing the risks of the smoke dispersion after a fire accident is crucial for the fire fighting mitigation plan. The visualization of these risks could be illustrated with graphic representations such as charts, maps, visual metaphors and diagrams, making the firefighting decision to better react with the risk’s accident management [1]. Horwitz and Koss [2] in their study mentioned that the understanding of risk is defined by the risk visualization. A risk map is an essential tool for the visualization of the risk characteristics over a given area. It defines the combination of the hazards and the vulnerabilities over an area and offers a representation of all the possible risks. It includes details which can define the best strategy for effective mitigation plans [3, 4].
Different researchers study the developed hazard models for a specific region based on the physiographic or environmental factors, specially for wild fire models with Geographic Information System (GIS) methods [5-7]. The combination of multi-criteria methods with GIS systems could result in the production of fire risk maps [8]. These risk maps could be the guide for strategically driven decisions [9].
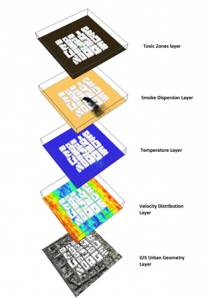
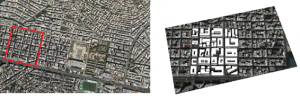
A multi-criteria risk map is composed from different layers of data. An example of a risk map defining the toxic zones after a fire accident in an urban environment is shown in Figure 7‑15. The different layers which are composing this risk map are defined from the following layers: (1) the GIS Urban Geometry layer: Collection of satellite images and urban geometrical characteristics, (2)the Wind flow distribution: the wind flow distribution inside the urban environment calculated with CFD methods, (3) the Temperature distribution Layer: The temperature layer calculated with CFD methods, (4) the Smoke dispersion Layer: The smoke dispersion is calculated with Lagrangian models, (5) the Toxic Zones Layer: The toxic zones layers are defined with the limits of the smoke concentration.